- Published on
Introduction to Counting Tokens, Prompt Caching, and Session Analytics Tools
- Authors

- Name
- Aymeric Chalochet
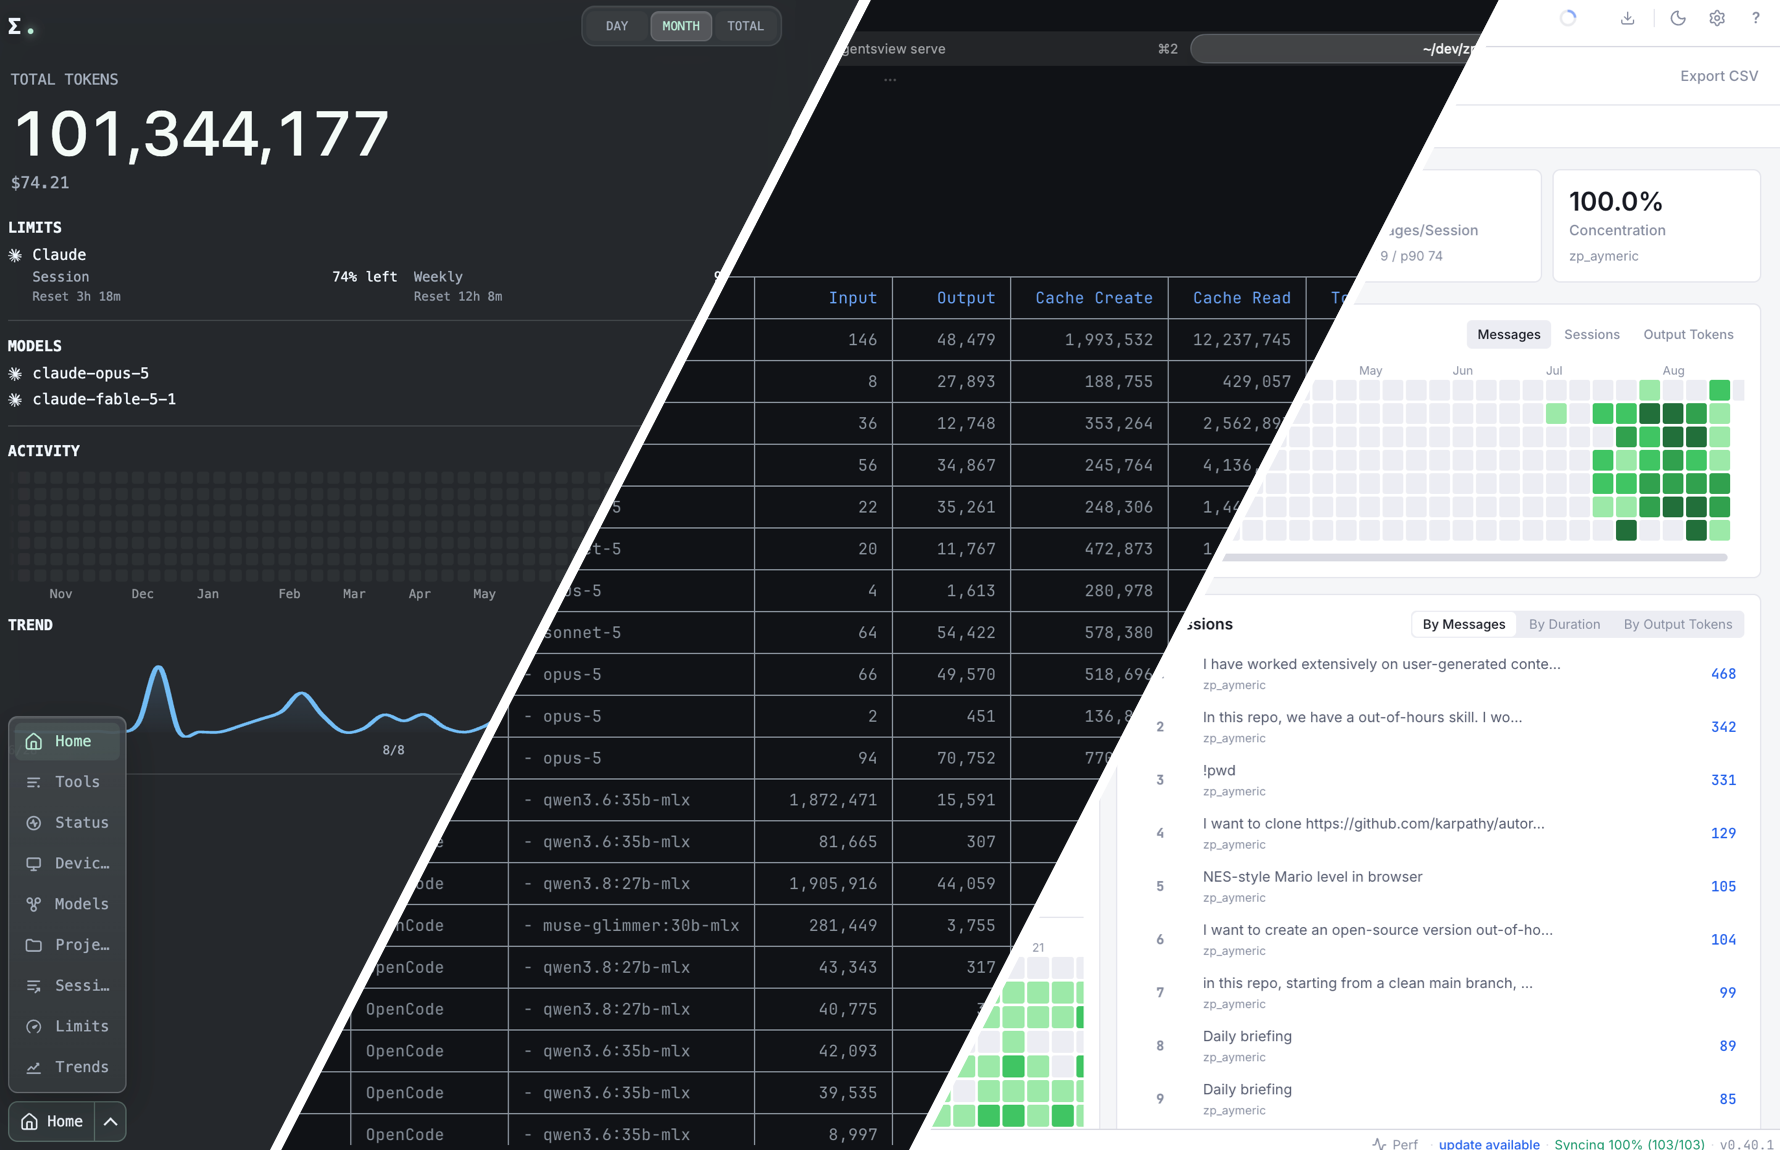
Someone asked me how many tokens I used after my last experiment comparing Qwen 3.8 27B, Opus, and other models. I had no idea, nor did I know how to verify it.
As I used both Claude Code and OpenCode, it was even harder to verify and compare.
This post explains how to count tokens across various tools, how prompt caching works, and tools to help analyze sessions.
Depending on the provider, prompt caching is also known as context caching or prefix caching. Prompt caching is used in the rest of the article.
Table of Contents
- Counting Tokens and Prompt Caching
- Built-in tooling in Claude Code and OpenCode
- Token Monitor
- ccusage
- AgentsView
- Conclusion
Counting Tokens and Prompt Caching
Large Language Models have no memory or state. When chatting with the model, the whole history of the conversation is sent to the model on every turn. The entire conversation history becomes input tokens, and the model's responses are the output tokens.
When Claude Code or OpenCode makes a tool call, the tools' output is sent as a message to the model. This is more input tokens.
The first turn is special. It includes the agent harness's system prompt, the project's context, which is the AGENTS.md and other rules of the project the session started in, and the user's first message.
On every subsequent turn, the previous turn's response and the new message are sent.
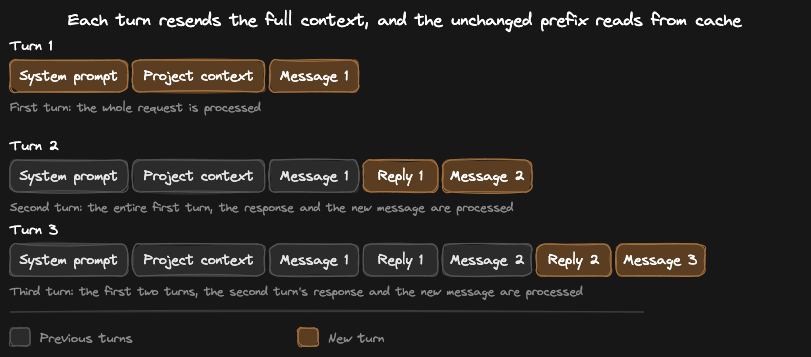
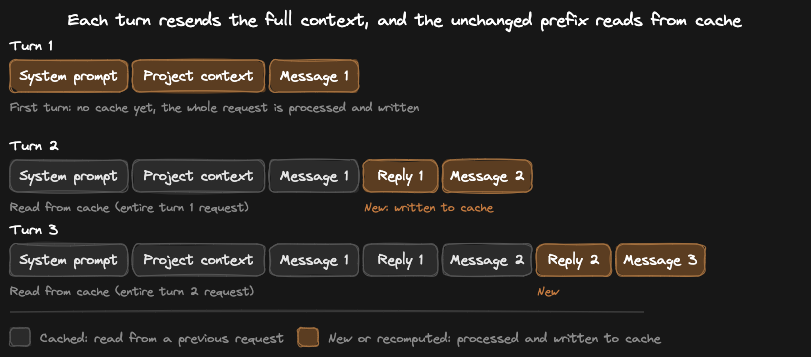
The diagram above and the following ones are adapted from the diagram in Anthropic's How Claude Code uses prompt caching page.
To optimize processing time and cost, all major AI labs implement prompt caching.
Previous turns are cached server-side. New turns get routed to specific servers based on cache location to optimize cache hits.
Cache writes get billed at a higher price than base input tokens, and cache reads get billed at a 90% discount by both Anthropic and OpenAI.
The more turns a session has, the more cost-efficient prompt caching is.
Anthropic and OpenAI call these input tokens "cache writes", and turns read from the cache are called "cache reads".
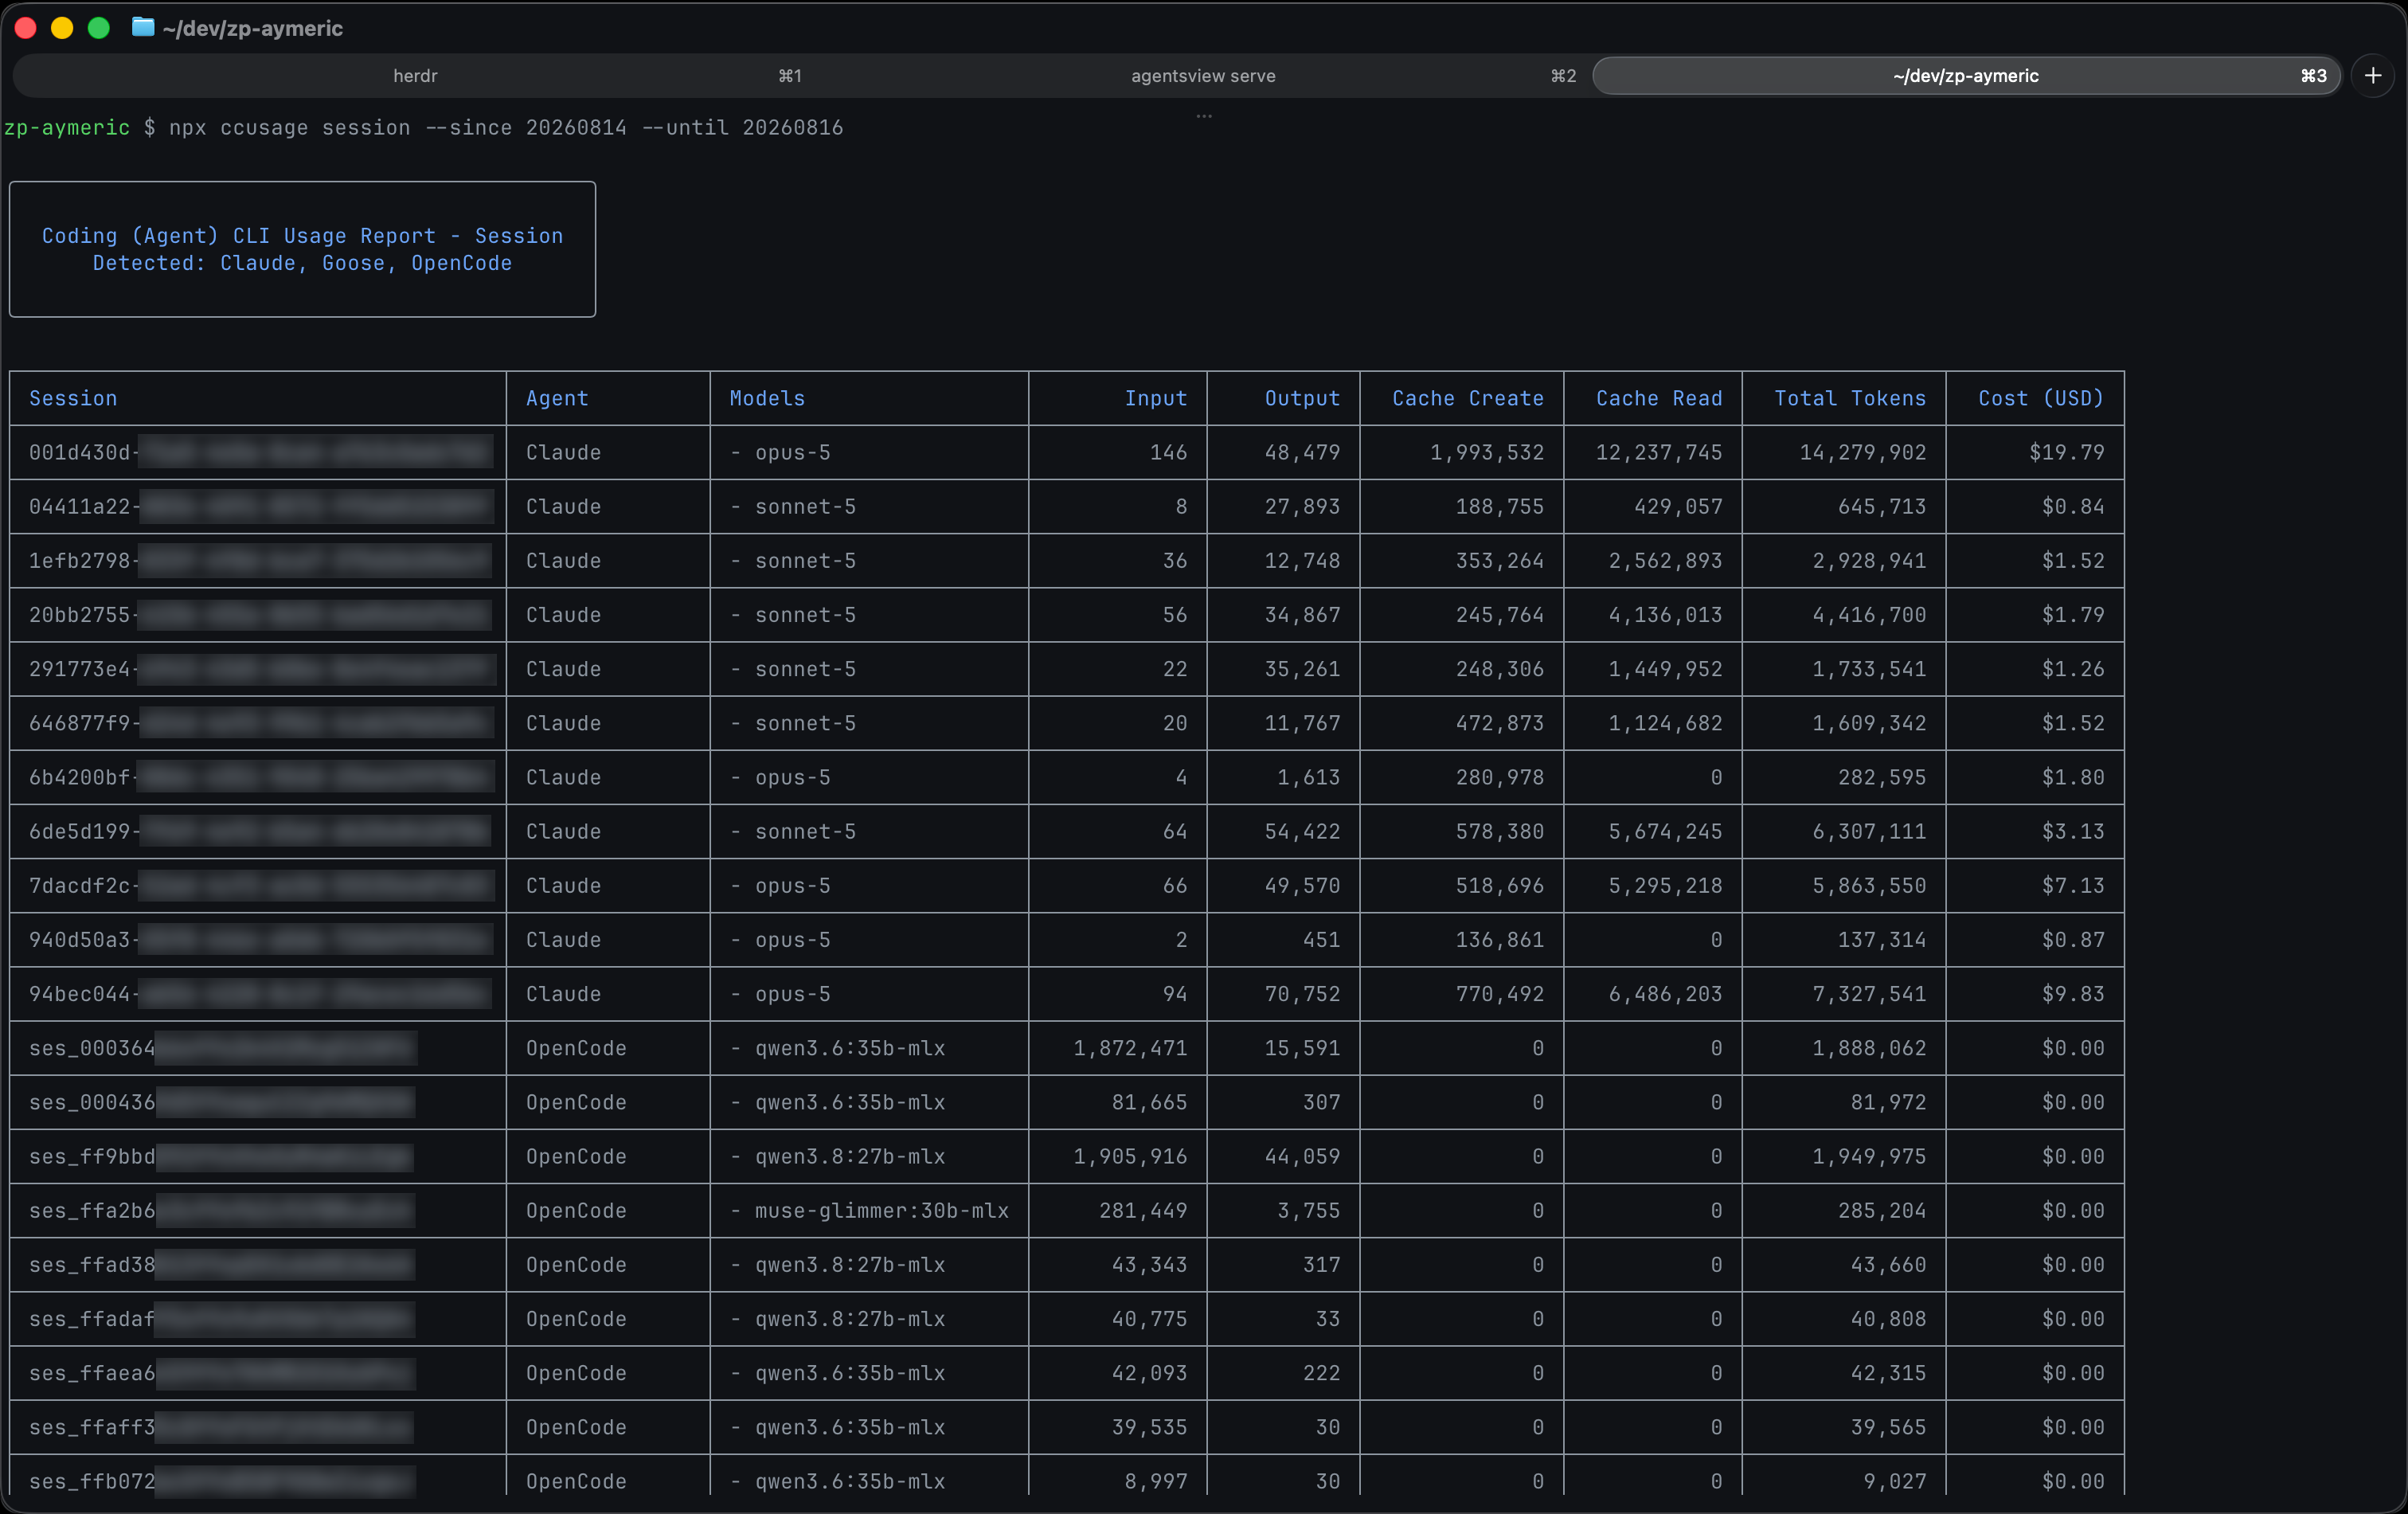
Local inference engines such as Ollama, llama.cpp, and vLLM implement Key-Value caches to reuse across turns. However, the tokens are still called input and output tokens, as illustrated in the ccusage screenshot further down.
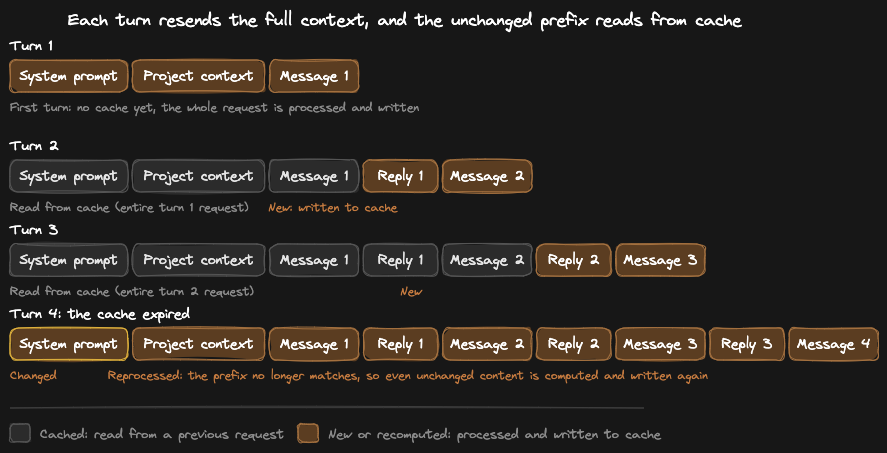
The cache expires after a TTL that varies based on the provider and plan. In the case of Anthropic, the cache is either five minutes or one hour.
Staying away from an idle session for too long leads to cache expiration and higher costs.
Additionally, several events can lead to cache misses. The most common ones are changing the model, the effort level, turning on fast mode, and adding MCP servers.
For more details, read the articles from the model providers, this page for Anthropic, and this page for OpenAI.
Built-in tooling in Claude Code and OpenCode
Claude Code provides the /usage command in any open session to review token usage.
It includes input tokens, output tokens, cache writes and reads. The data is split per model when using subagents.
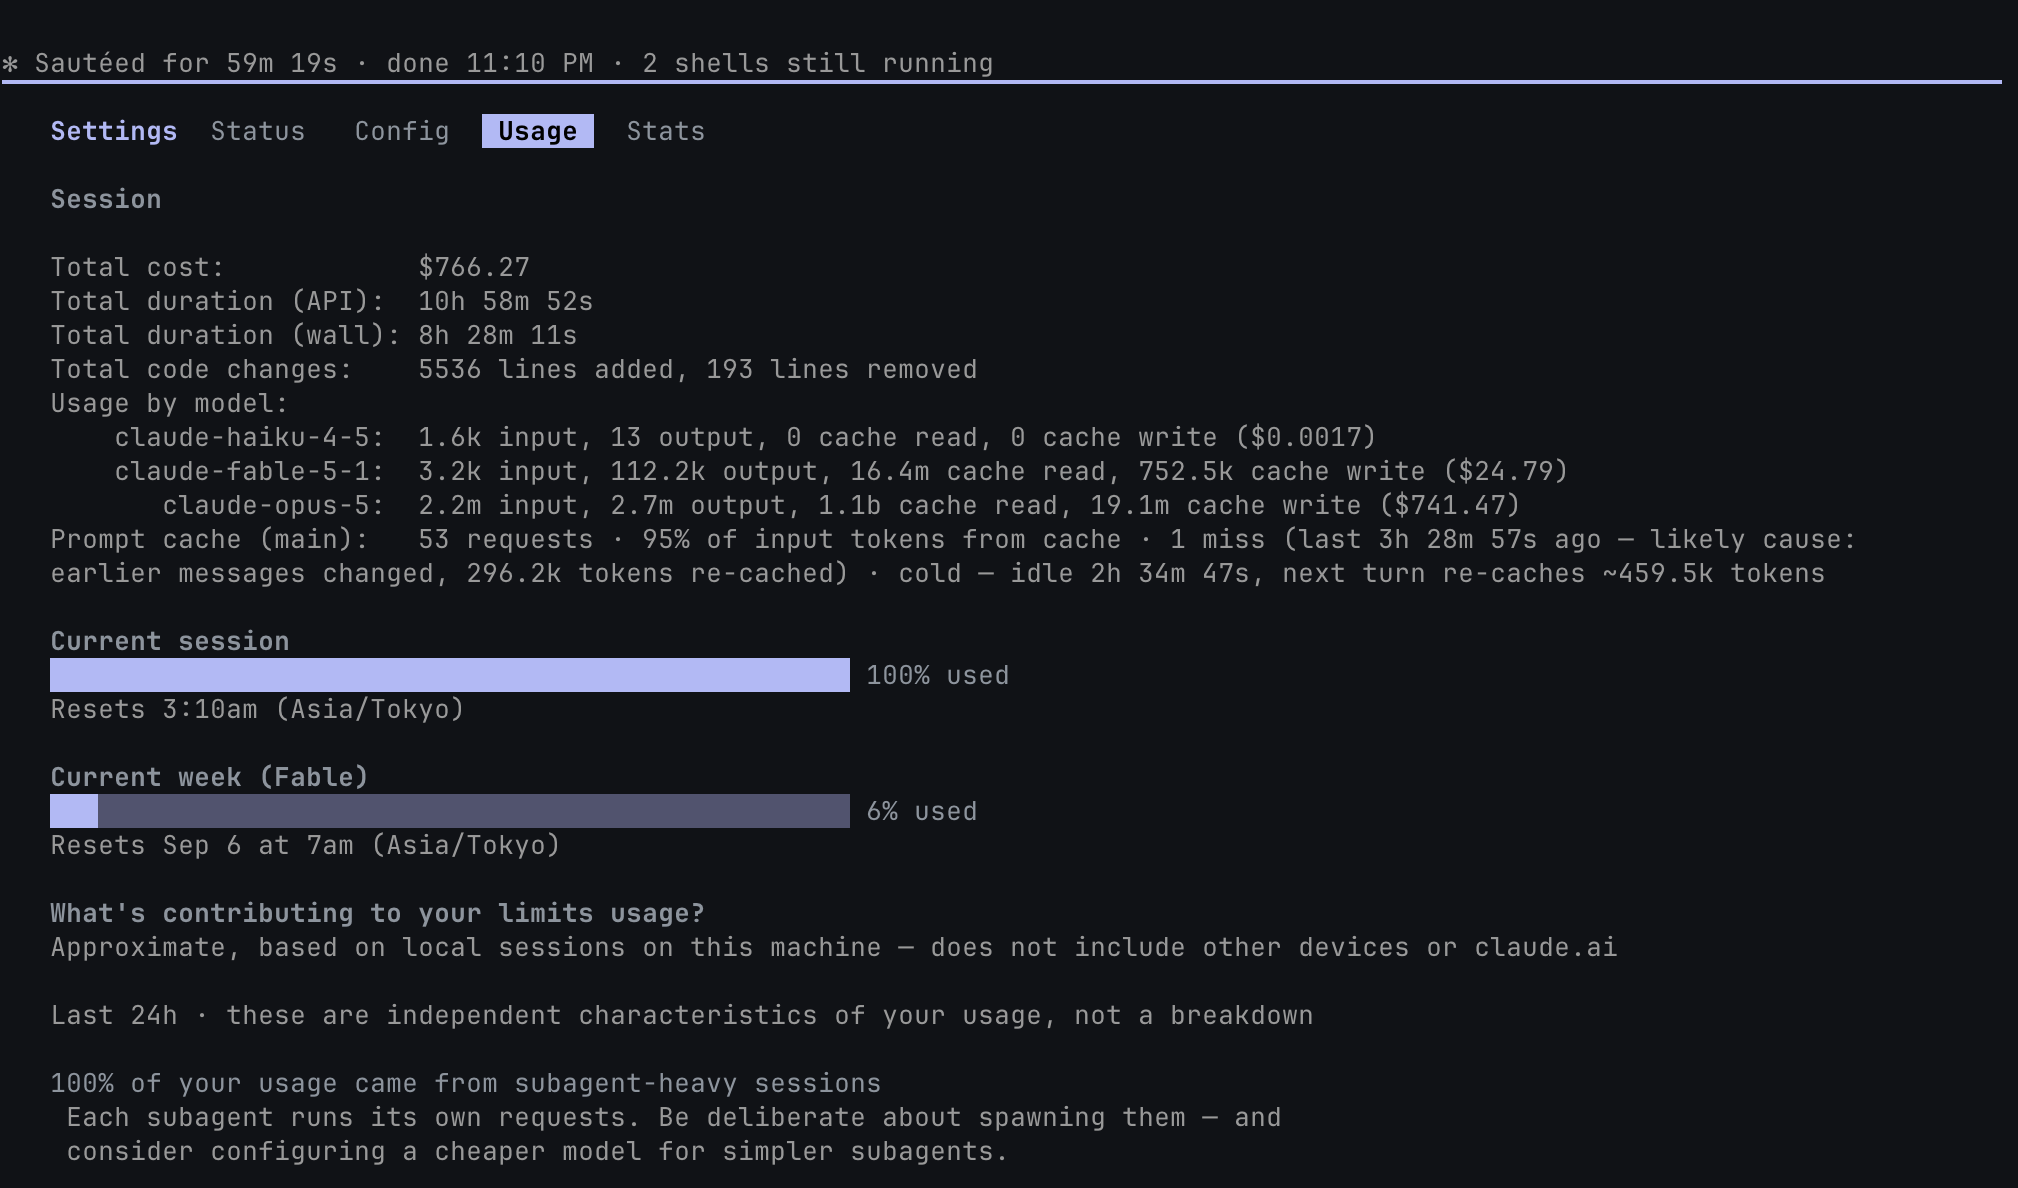
Claude Code doesn't provide a way to review token usage outside of a session. The Claude desktop app is also fairly limited in that regard.
OpenCode doesn't provide any local command or tool to review token usage.
Reviewing token usage across sessions and across different agent harnesses is possible using third-party tools. The rest of the article presents a few I tried, with their pros and cons.
Token Monitor
Token Monitor is a local-first desktop widget for tracking token usage, costs, and limits across 35+ AI coding tools—including Claude Code, Codex, Cursor, OpenCode, and more.
Token Monitor displays a total number of tokens used over a period, without specifying input, output, cache writes and reads. The period can be picked from only three choices: the current day, the current month and the total.
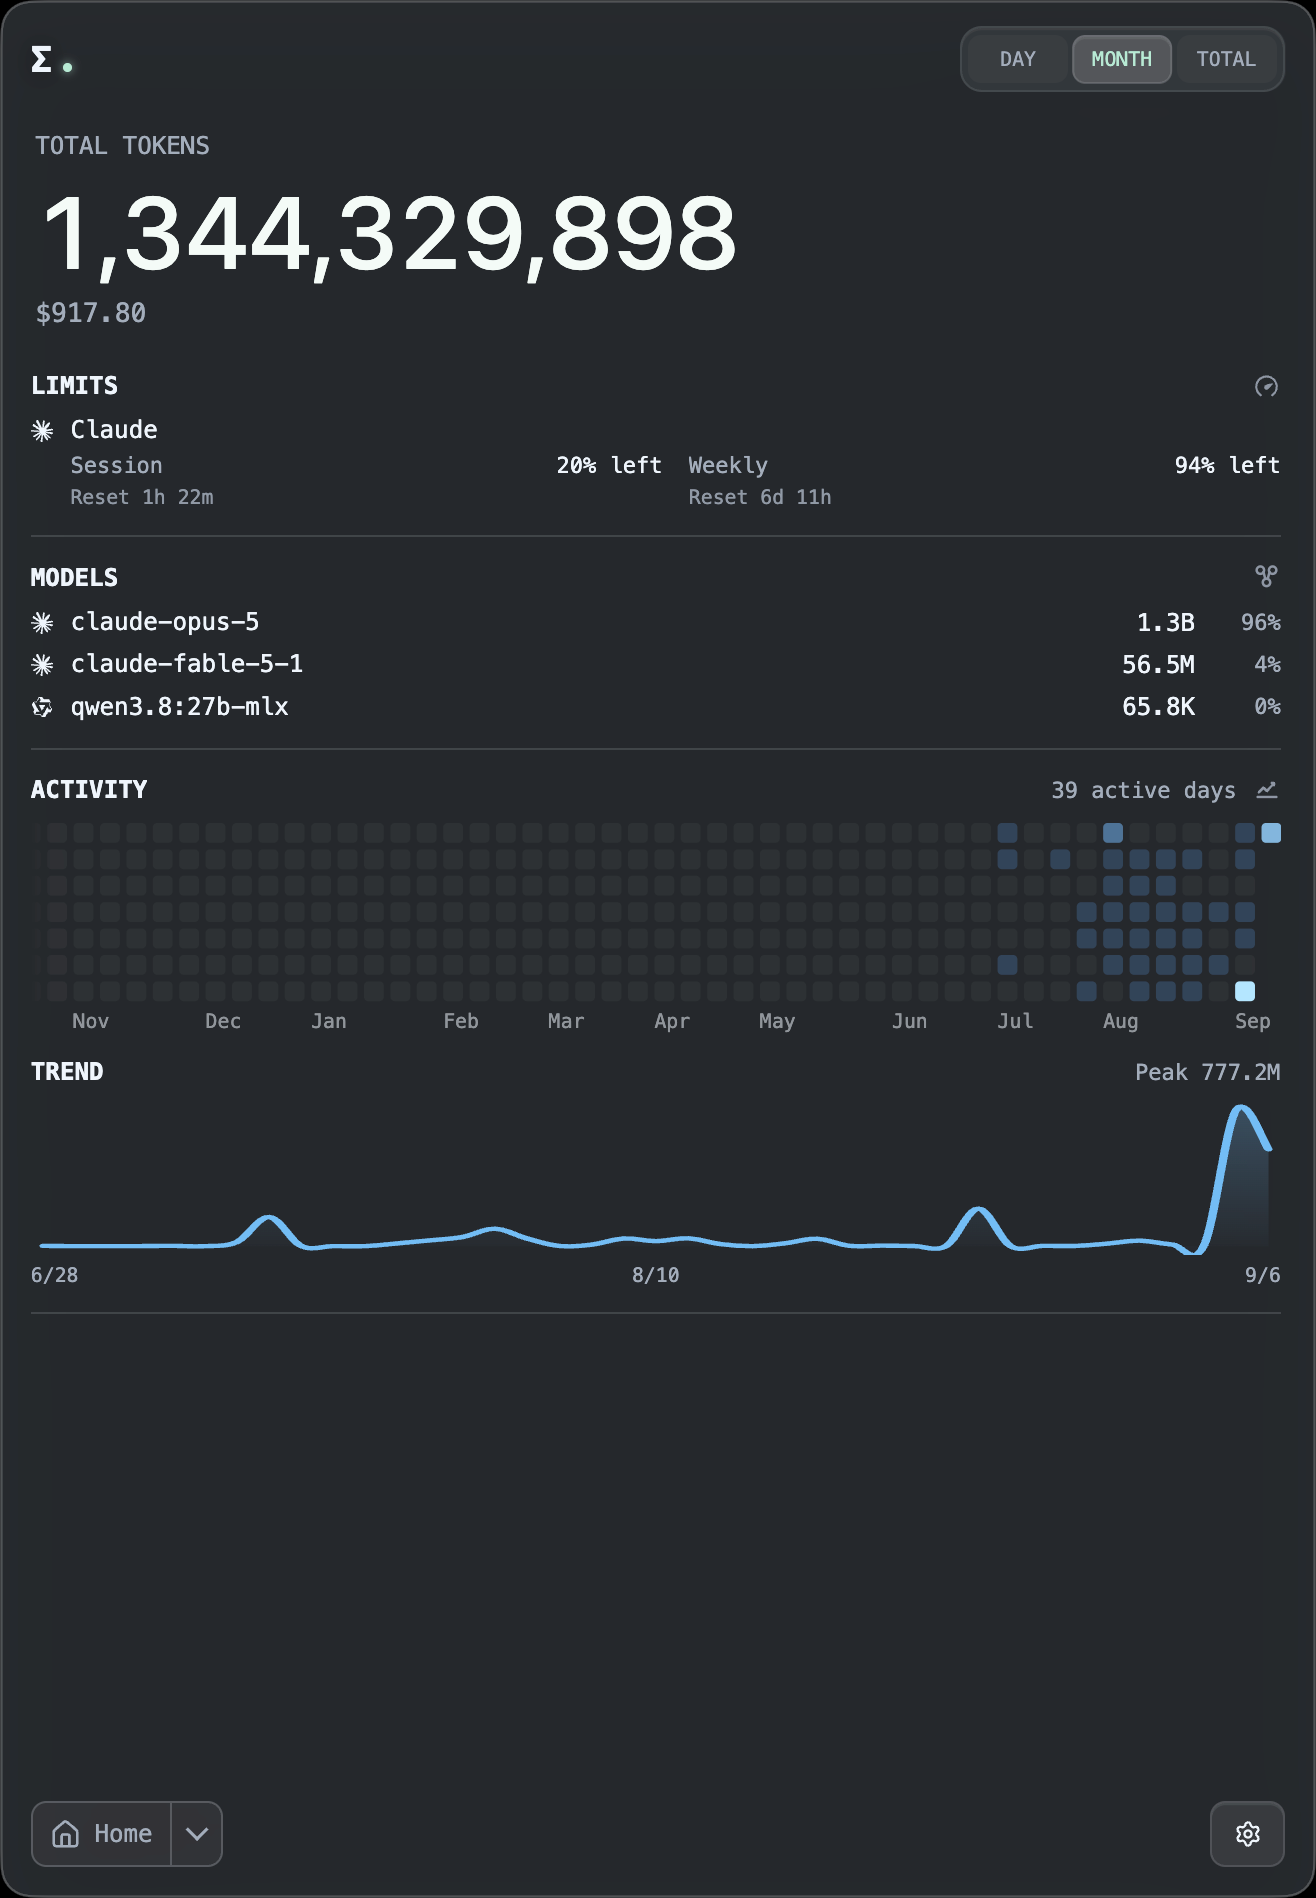
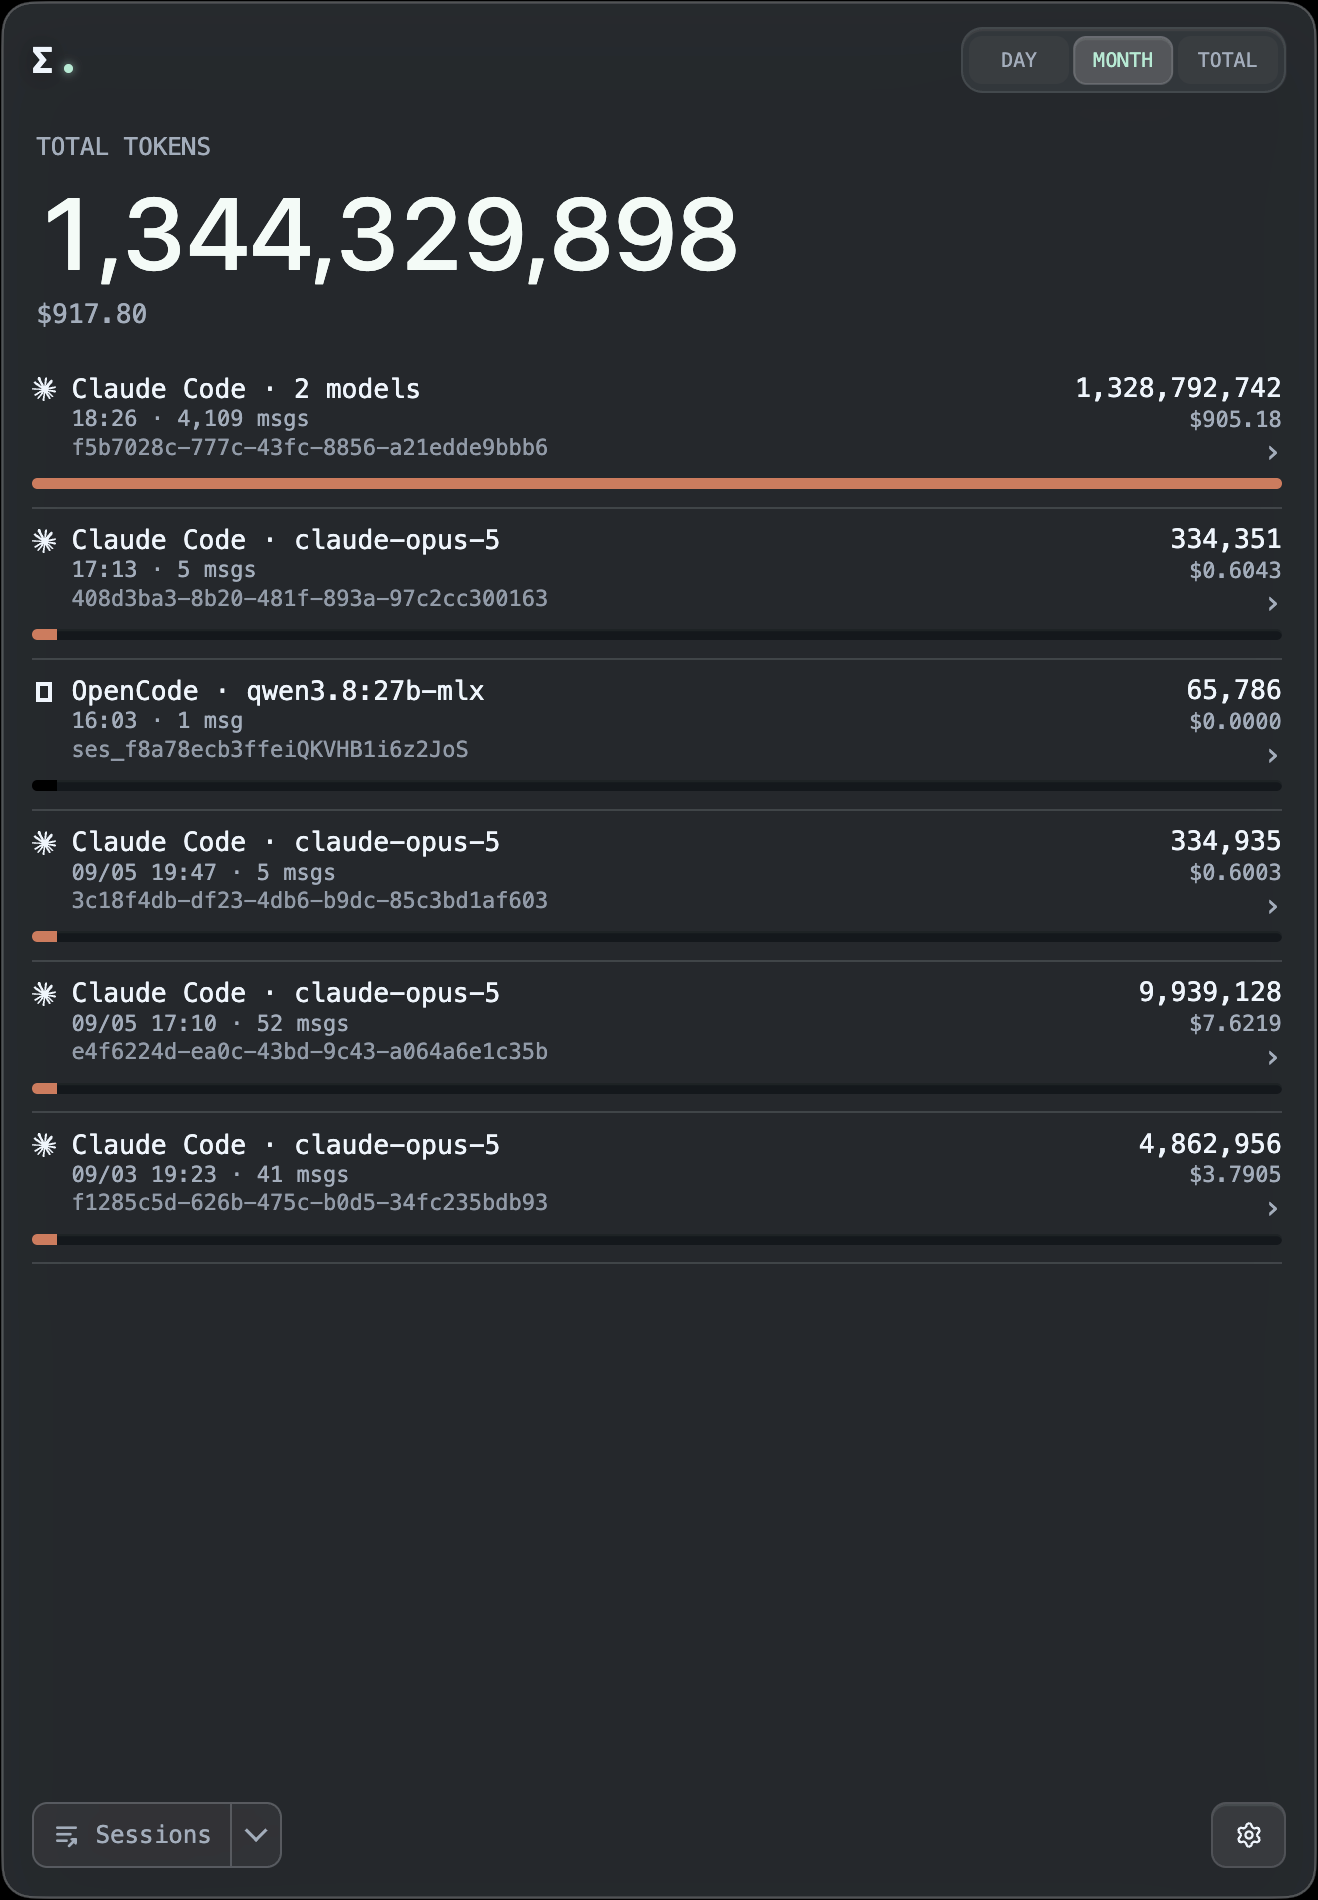
The list of sessions doesn't display any title, only the model(s) used, the date, the number of tokens used and the equivalent cost.
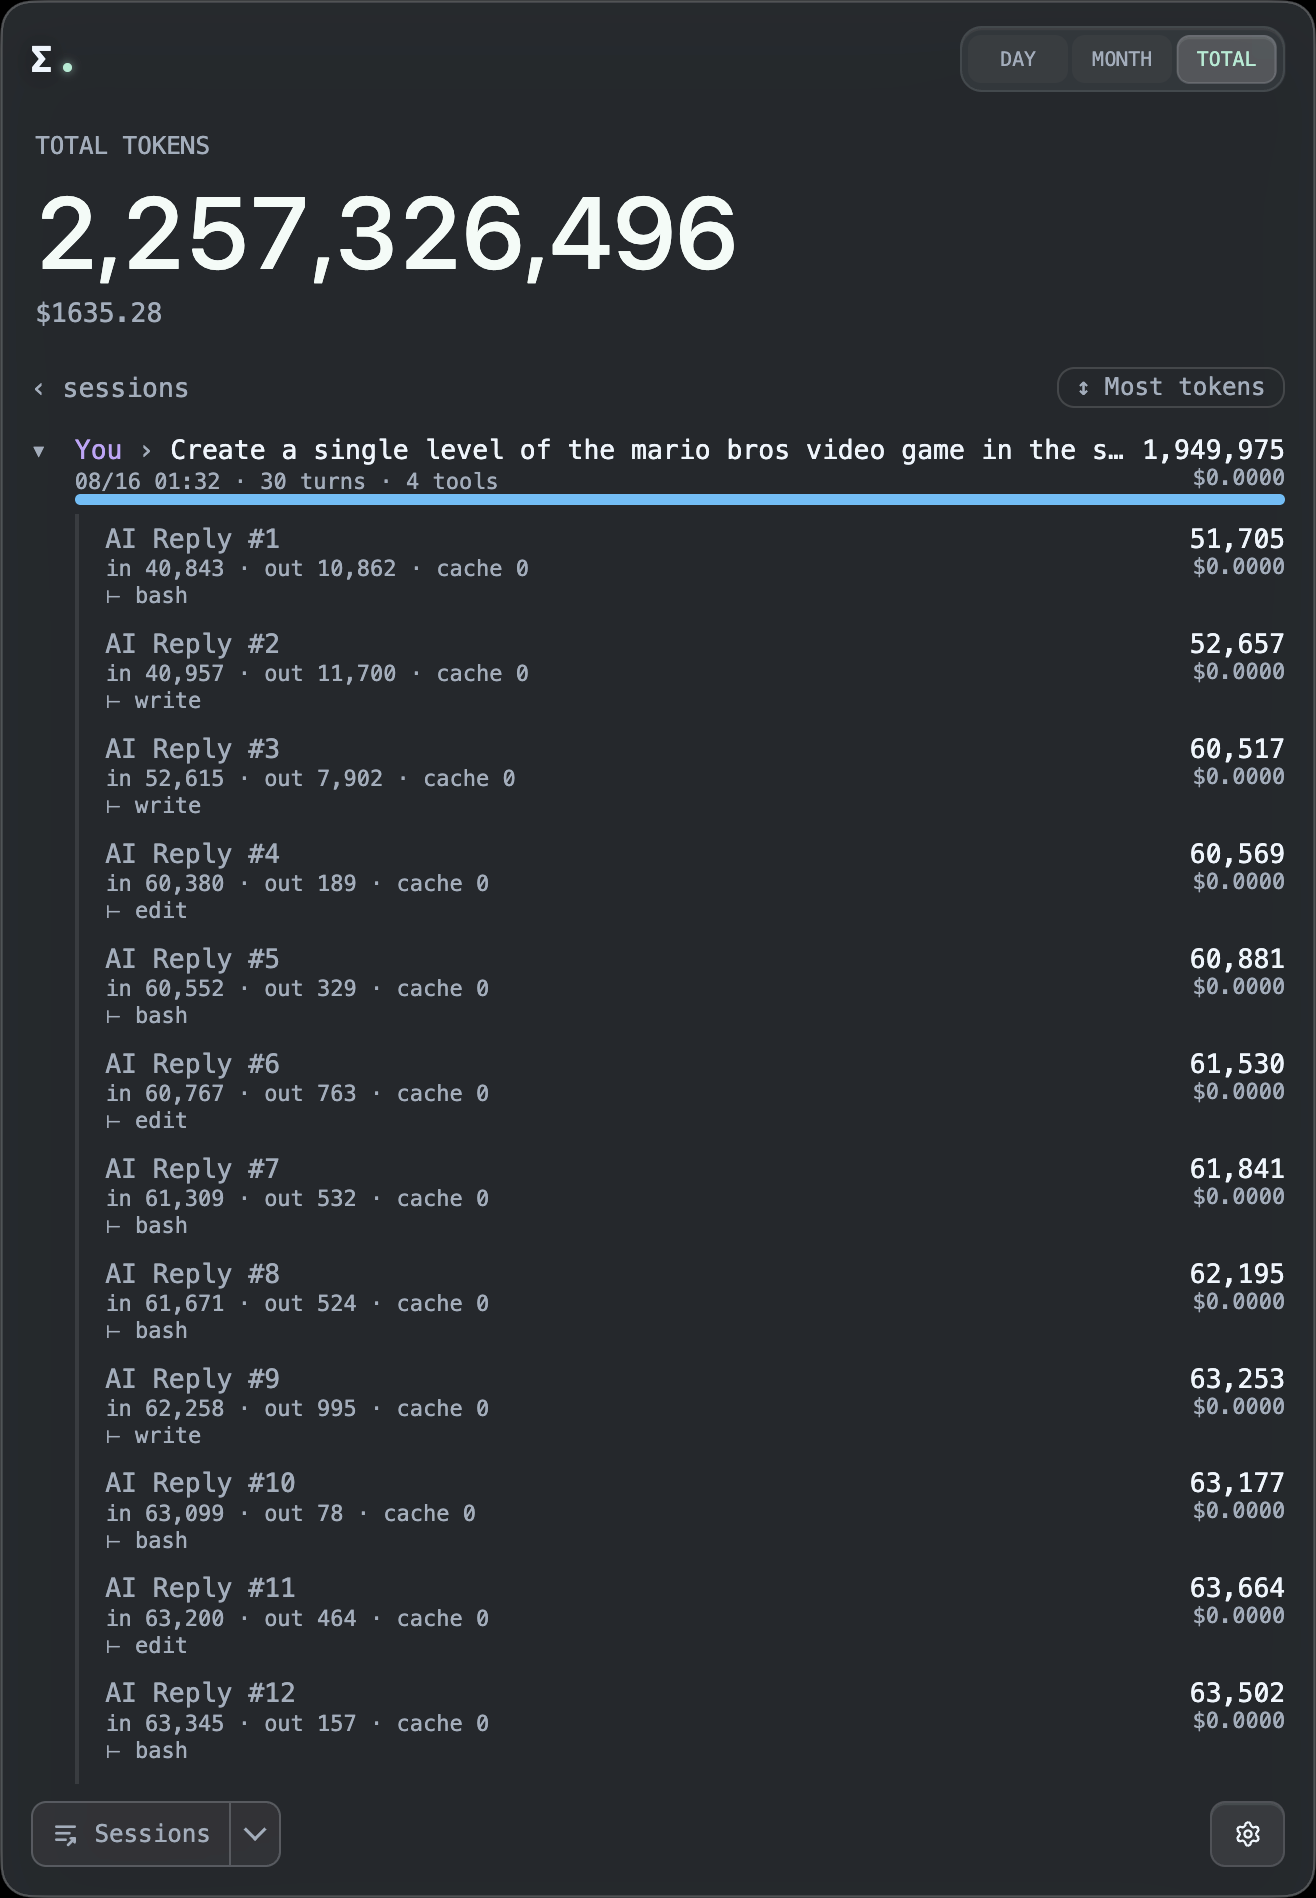
Finally, the level of detail for a given session is limited. It contains the start of the initial input prompt. Every turn after that is present without the details of the message or response, only the input and output prompts.
Token Monitor is too limited to be useful.
ccusage
ccusage is a fast local CLI for tracking tokens and estimated costs across Claude Code, Codex, OpenCode and many more agent harnesses.
ccusage is easy to use. The reports include input and output tokens, cache writes and reads, models, and cost. It does not provide any other insights into sessions.
It is the best tool of the three to compare token usage across sessions easily, thanks to having the simplest interface and reporting.
AgentsView
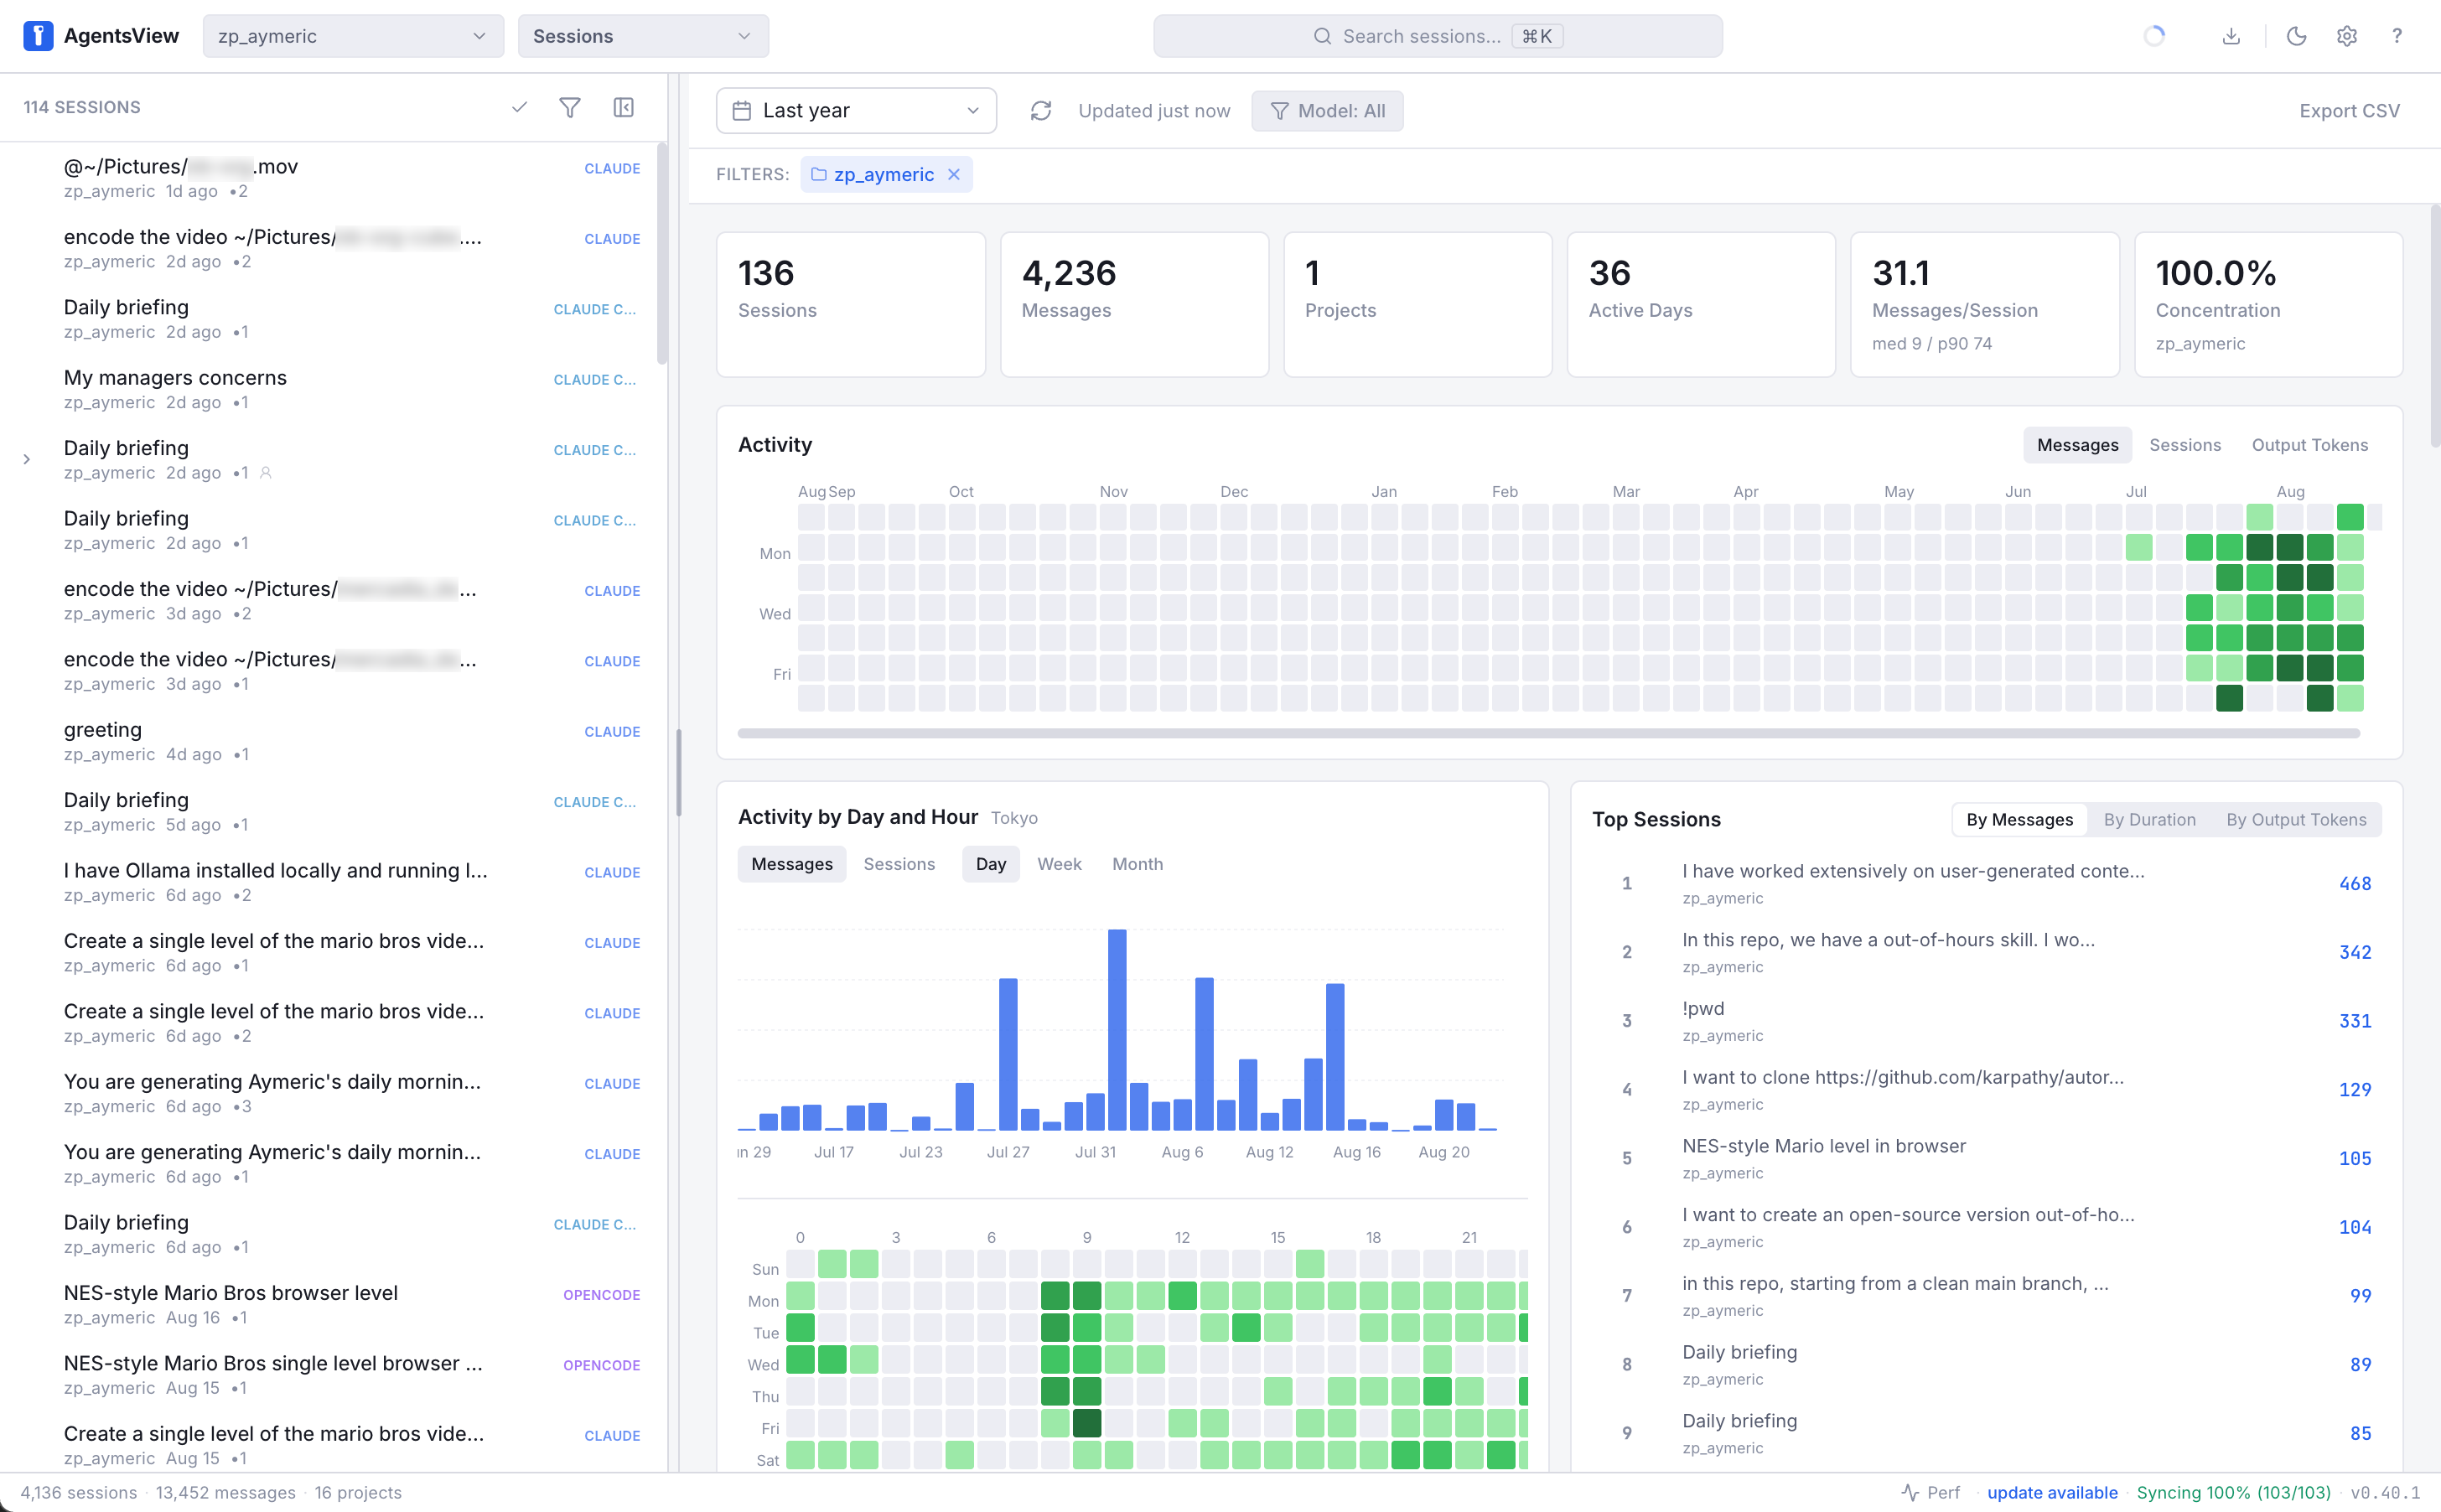
AgentsView is a local-first, browser-based, session and token usage analytics tool for coding agents, supporting Claude Code, Codex, and more than 20 other agents.
It is the most complete session analytics tool presented in this article.
The main view shows statistics from all the sessions, the list of sessions, a search bar to find specific sessions, and several kinds of filters.
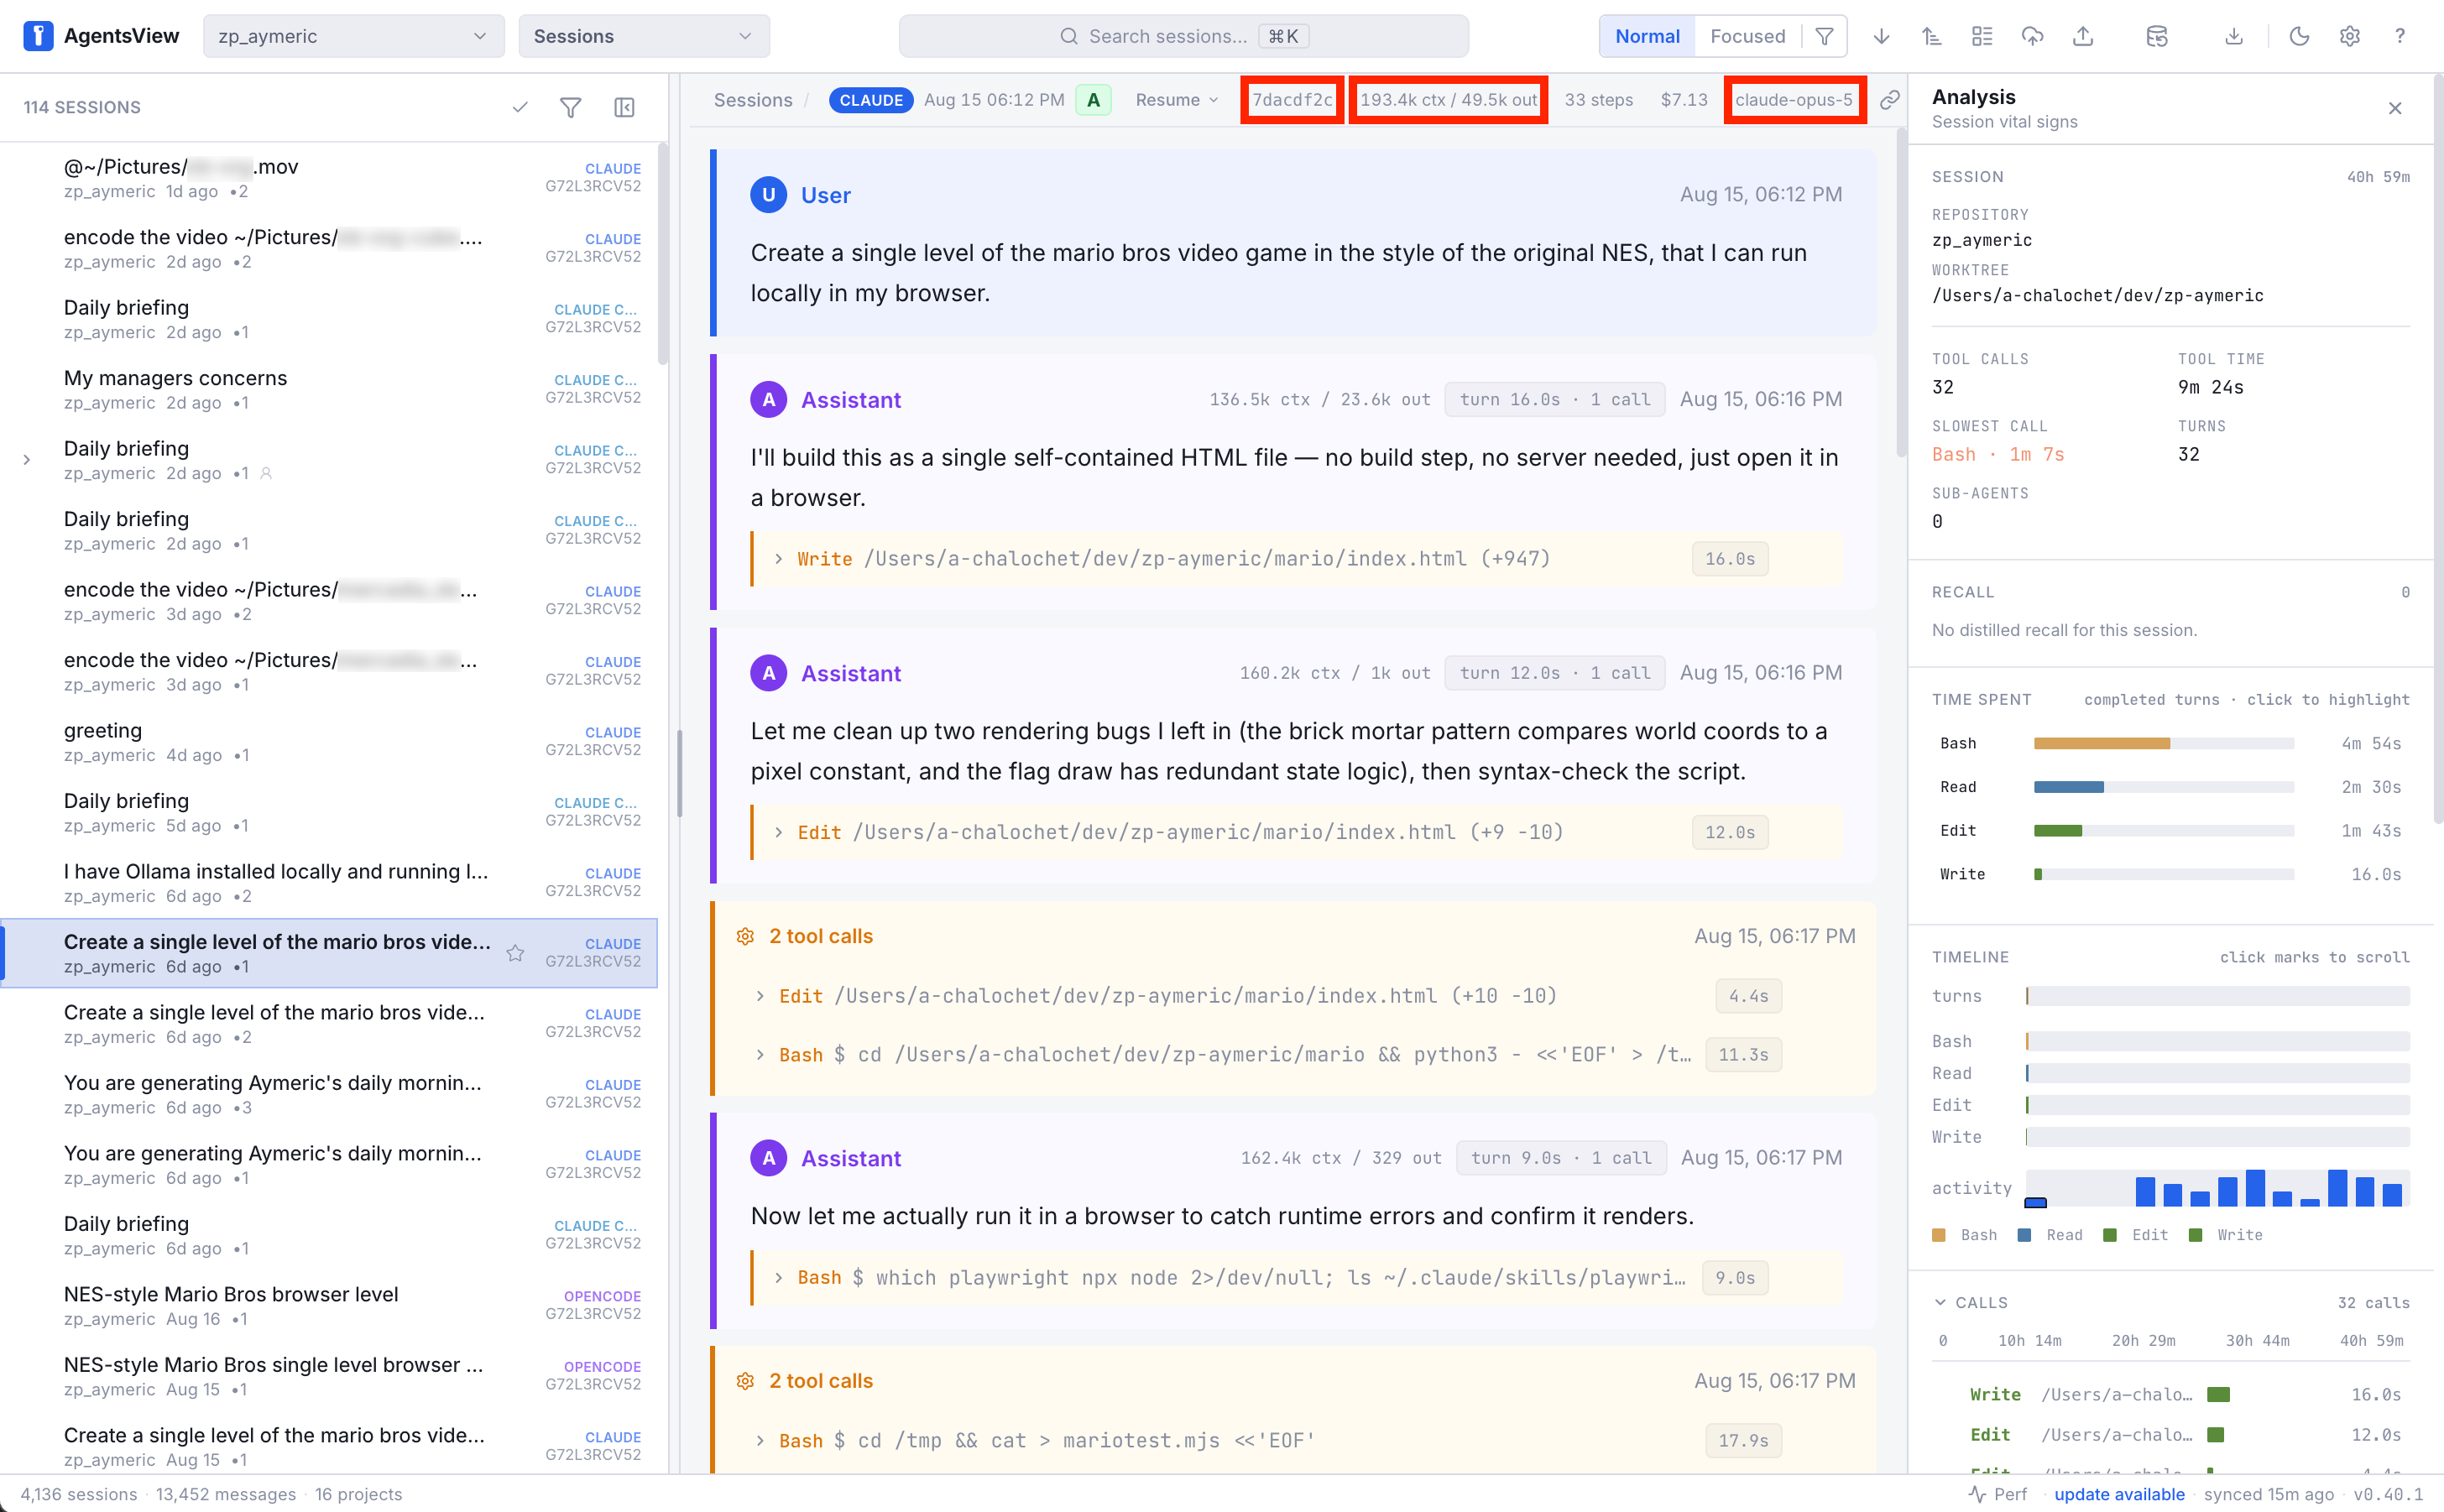
For each session, AgentsView displays the input and output tokens, the entire session's turns, the tool calls, and the time split per turn or per tool call.
The cache writes and reads are unfortunately missing.
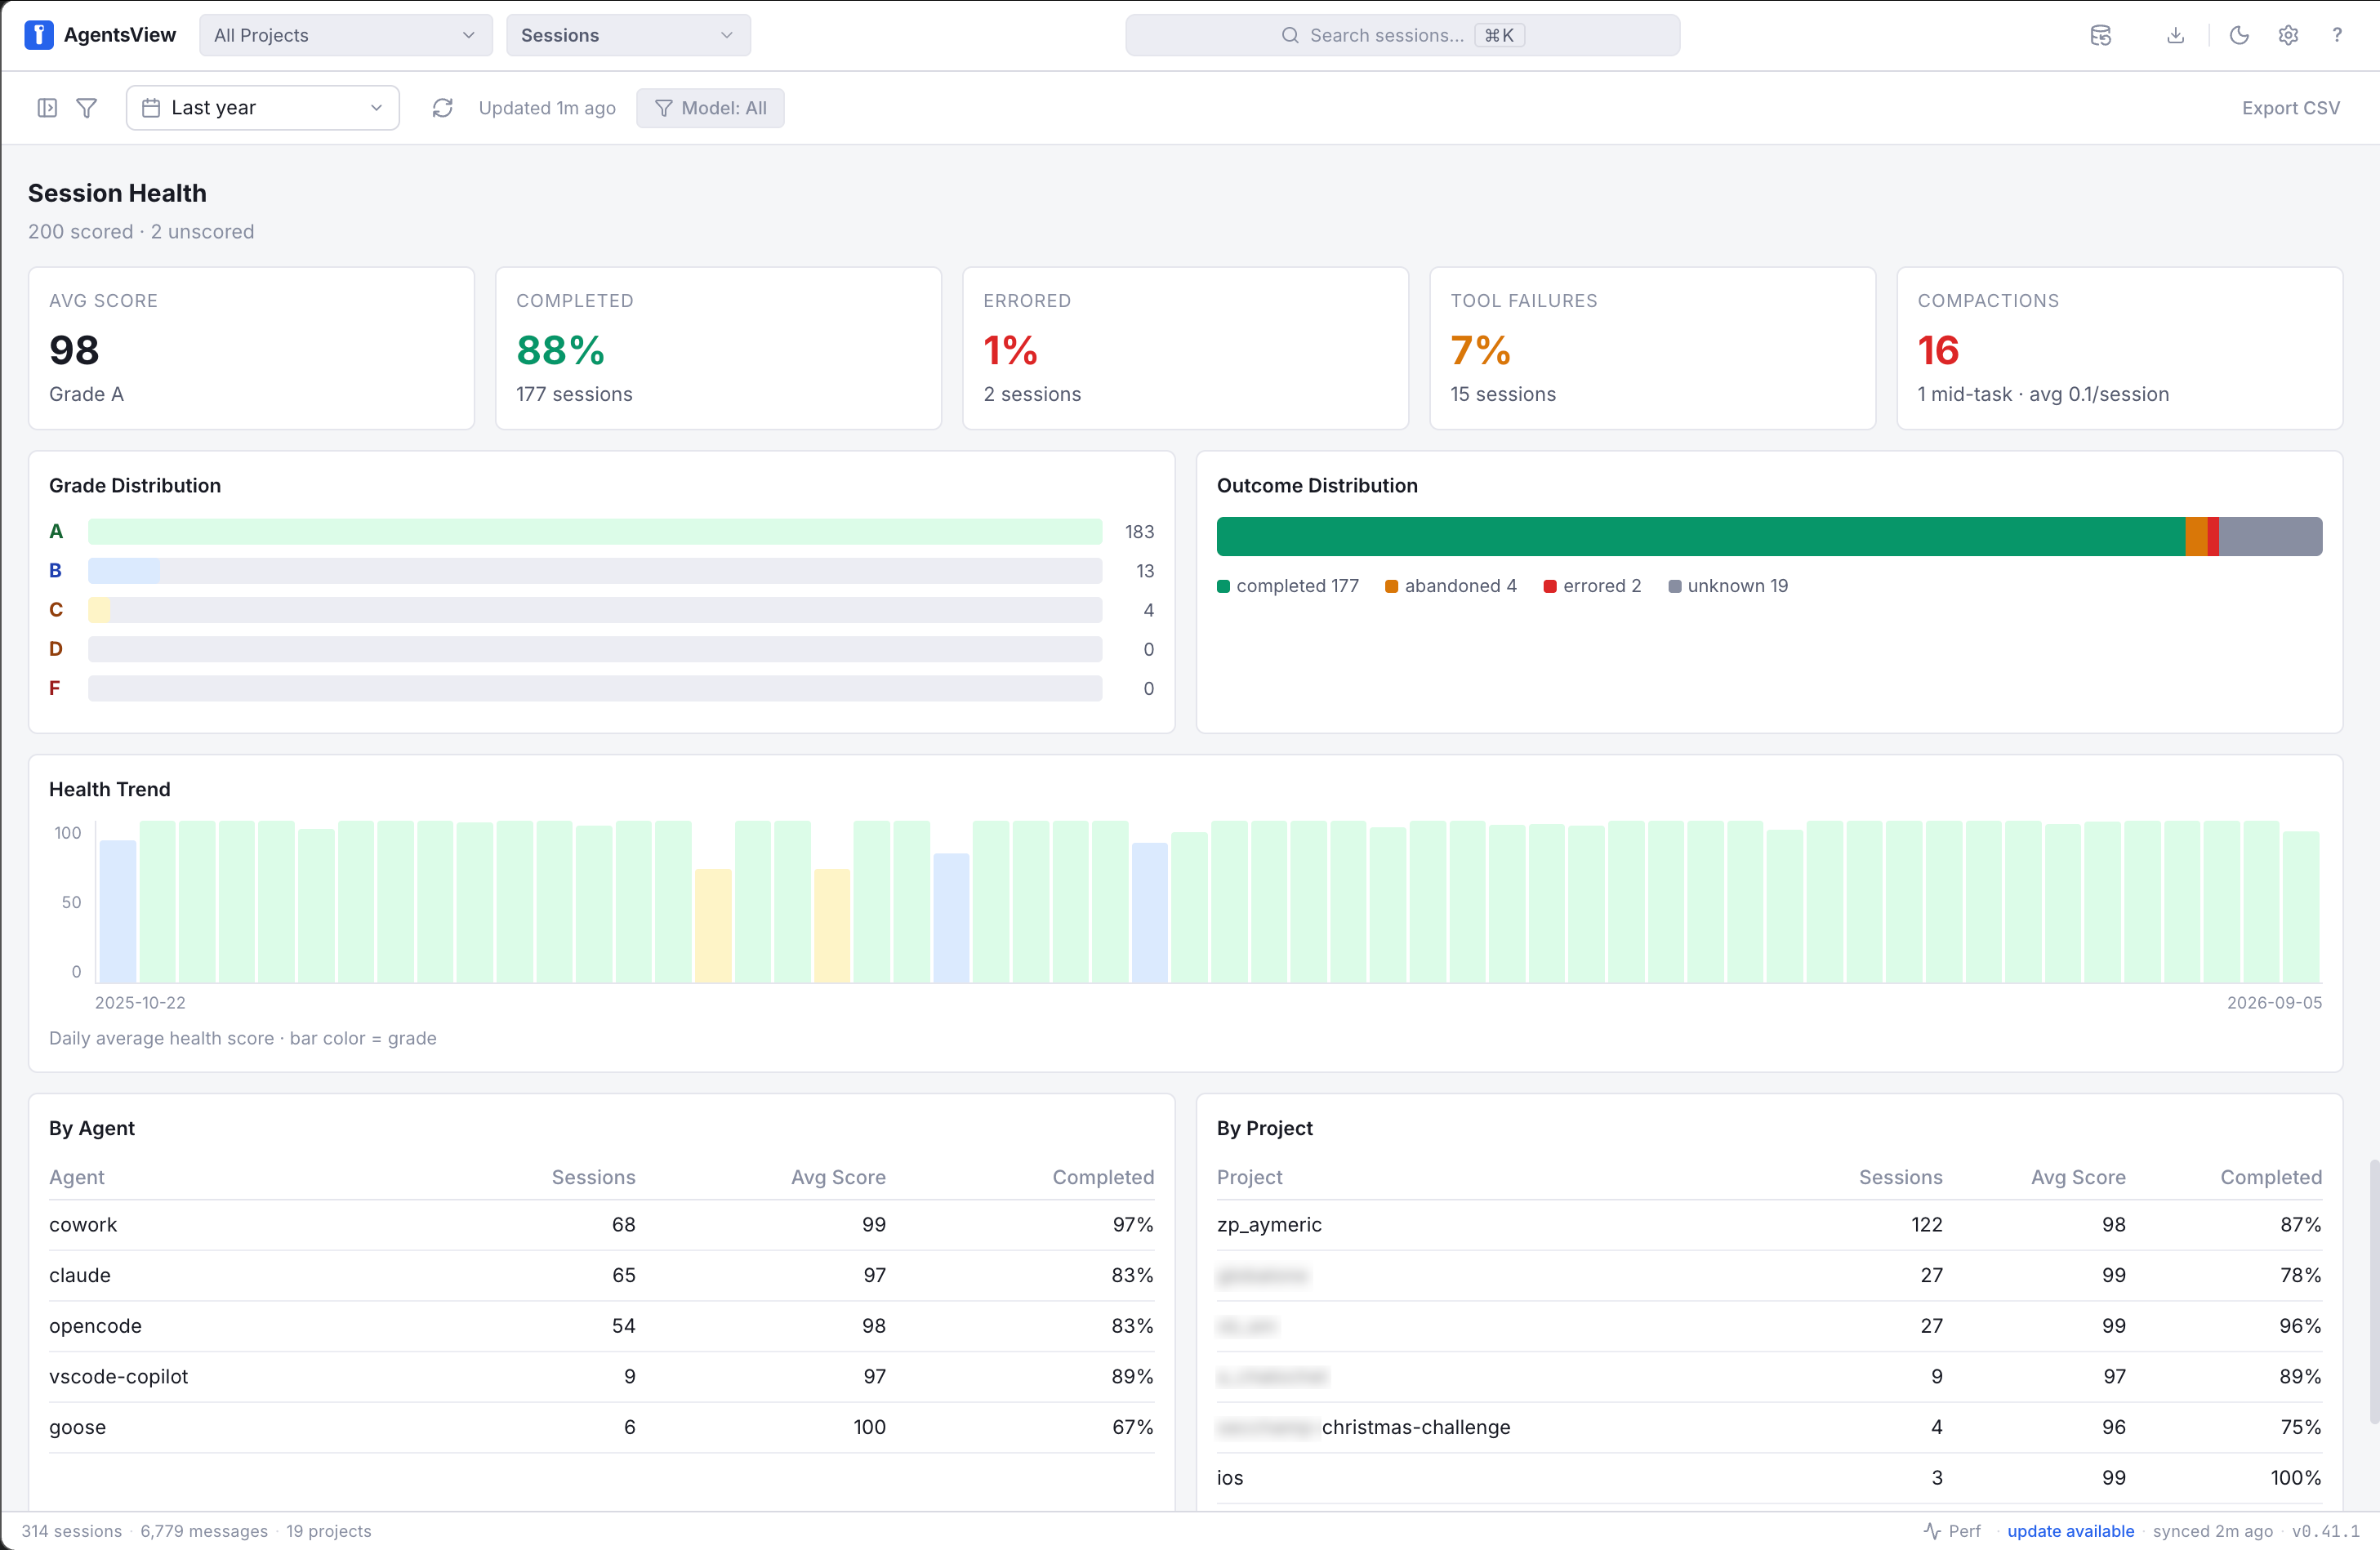
Further down, the main view displays aggregated stats and averaged session health scores. It also displays the score and stats split per model, agent harness, and project. The view lacks enough detail to be useful.
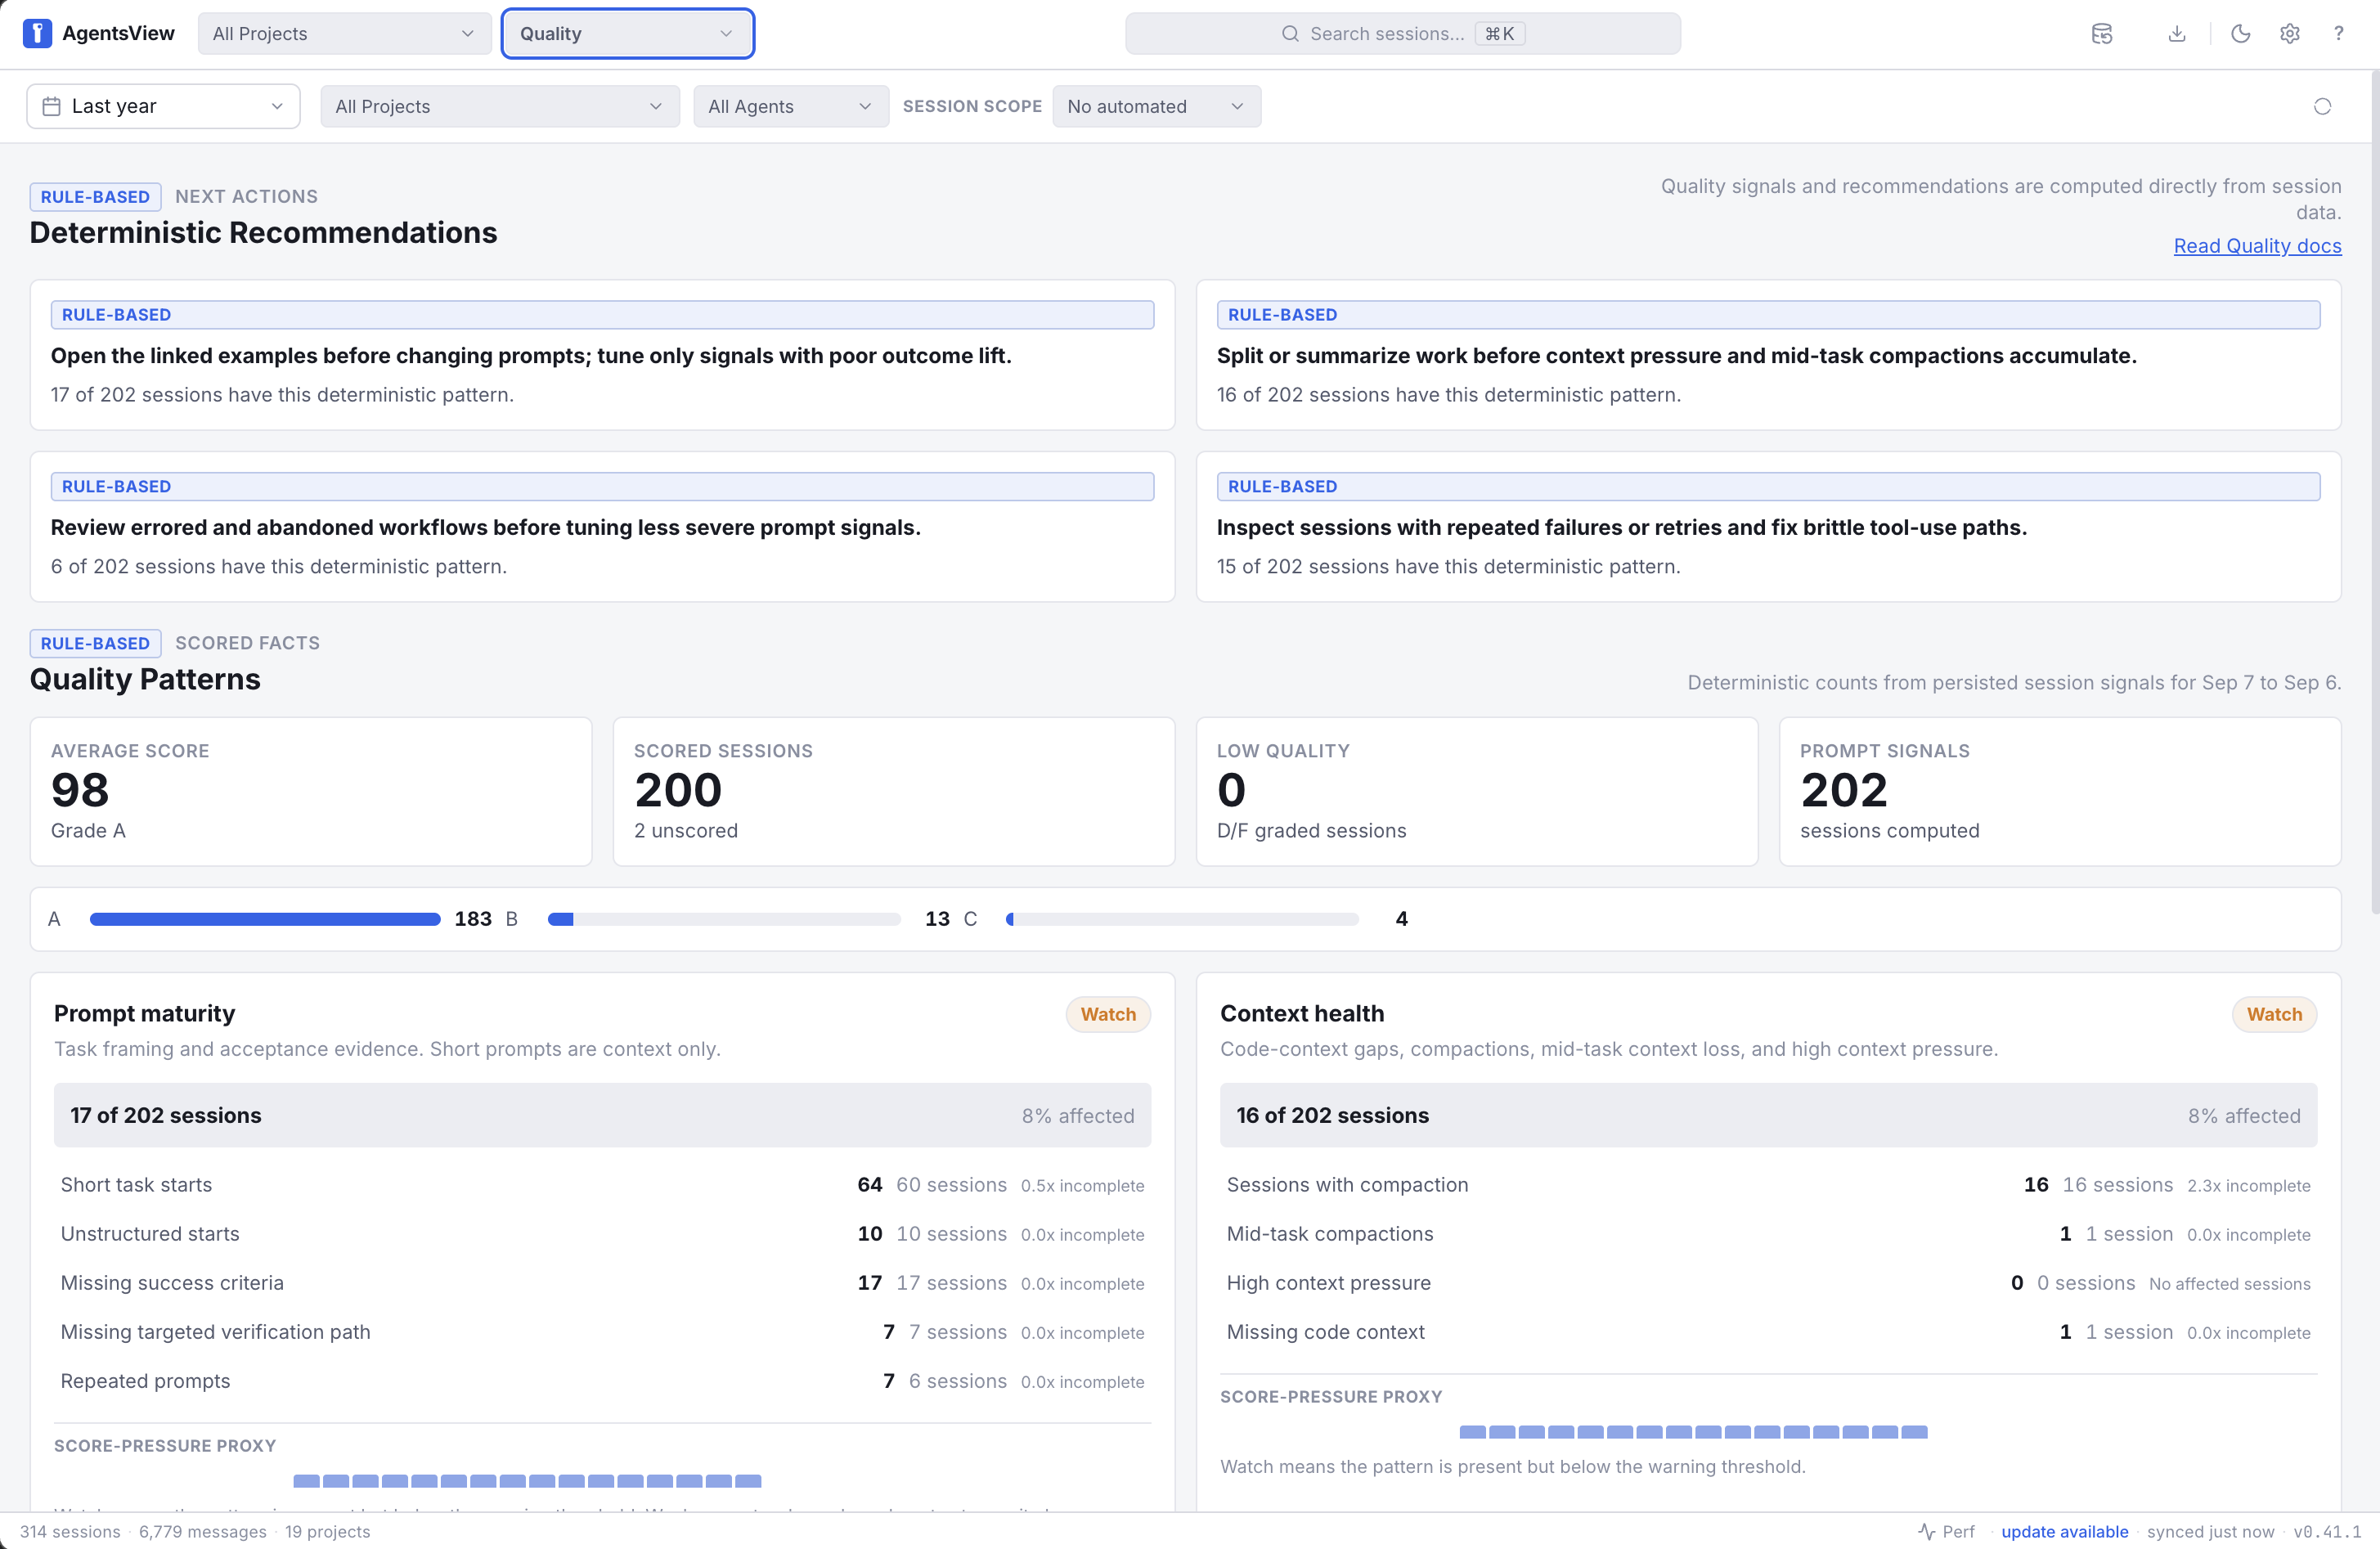
A "Quality" view displays more details of the aggregated session quality score, providing recommendations for improvement based on static rules and how often the patterns were observed.
The intent behind the session quality score is good, but the analyses lack details and clear actionable insights to be useful. I'm hoping this quality analysis gets polished to become useful to improve prompting and the projects' harnesses.
Conclusion
LLMs give the impression of following a conversation by processing the entire conversation history on every turn.
Model providers implemented prompt caching to optimize performance and cost, drastically discounting tokens read from the cache. Coming back to a session before the cache expires is the biggest lever to optimize session costs. A few simple rules help too, like not changing a model mid-conversation.
To investigate token usage, the simplest tool is ccusage. It provides the simplest report on token inputs and outputs, and on cache writes and reads.
For in-depth session analytics, AgentsView is the most complete tool. Its main flaw is not displaying cache writes and reads.